Home temperature monitoring

2020-01-10 python raspberrypi influxdb grafana
I had an unused Raspberry Pi 3 and some free time during holidays. Here is what I built to monitor temperature and humidity. It’s just a working prototype but it was both simple and fun to do.
I used Grafana and InfluxDB because both run on ARM and Raspberry, and are very easy to set up. Both use the Go language, so no specific runtime environment is needed.
Hardware
It all started with the Raspberry Weather web site, which brought me to the DHT22 and DS18B20 sensors.
I bought the temperature module from AZ Delivery. It’s a DHT22 (AM2302) temperature and humidity sensor soldered on tiny board with a small resistance. As a result, all you need is provided (even jumper wires), you don’t need anything else: no breadboard, no resistance… AZ Delivery also provides some documentation about their product as a PDF e-book. which explains how to plug this module on either an Arduino or a Raspberry.
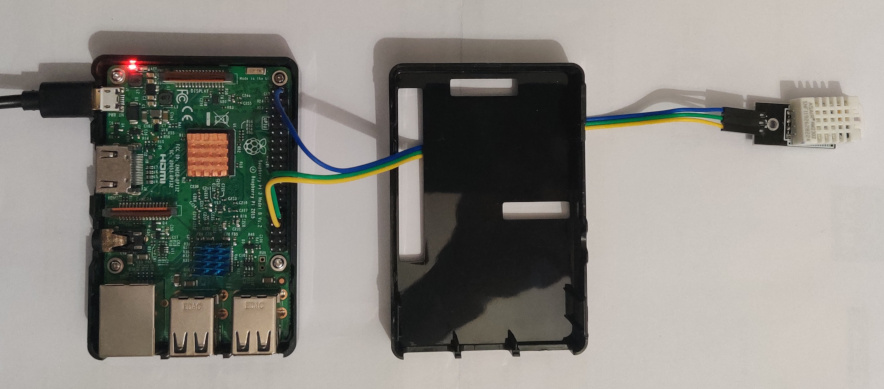
I used the Raspberry Pi 3 I had, but a smaller or older board should be enough.
Software
Raspbian
First I flashed a brand new Raspbian Buster on the micro SD card. The image can be downloaded on Raspberry Pi web site. With raspi-config I configured the network (WiFi), and enabled SSH.
InfluxDB
Then I installed InfluxDB on the Raspbian, by adding the InfluxData Debian repository
/etc/apt/sources.list.d/influxdb.list
deb https://repos.influxdata.com/debian buster stablecurl -sL https://repos.influxdata.com/influxdb.key | sudo apt-key add -
sudo apt-get update
sudo apt-get install influxdb
sudo systemctl start influxdbTo check that InfluxDB is running, you can cUrl it:
curl -s -v http://localhost:8086/ping
...
< HTTP/1.1 204 No Content
< Content-Type: application/json
< Request-Id: c28feb69-30bc-11ea-8628-b827eb3ca438
< X-Influxdb-Build: OSS
< X-Influxdb-Version: 1.7.9
Grafana
As Grafana is concerned, I downloaded the .deb file and installed it as described on Grafana web site
wget https://dl.grafana.com/oss/release/grafana-rpi_6.5.2_armhf.deb
sudo dpkg -i grafana-rpi_6.5.2_armhf.deb
Grafana service is not enabled nor started by default.
sudo systemctl daemon-reload
sudo systemctl enable grafana-server
sudo systemctl start grafana-server
To check that Grafana is running, you can open a browser on http://myraspberry.local:3000,
and log in.
The default admin/admin user account can be changed in /etc/grafana/grafana.ini config file.
Code
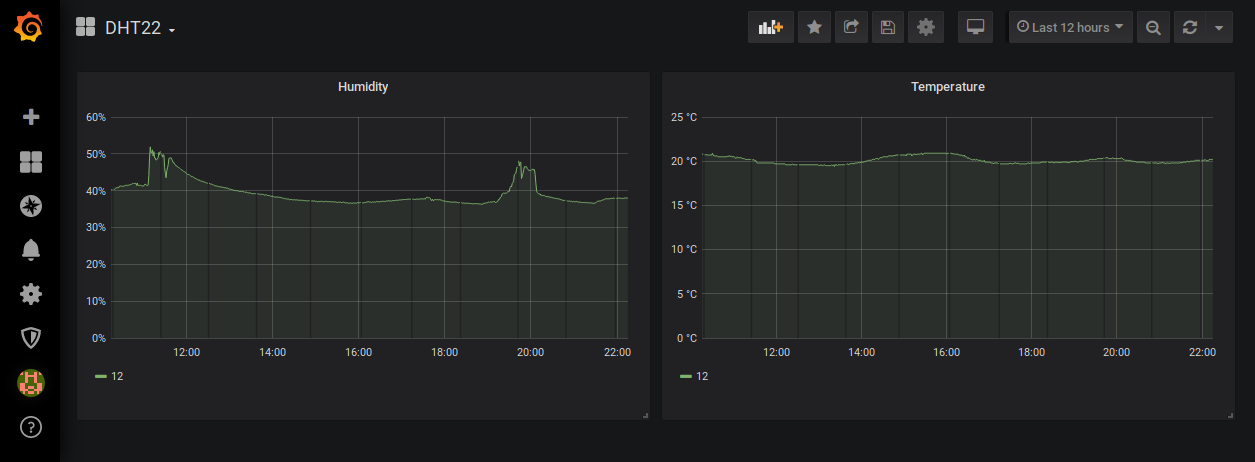
The code reads temperature and humidity from the sensor every minute or so. And then writes the result in the InfluxDB database.
I hesitated to do it with Go language, but I chose Python because I immediately found simple code examples.
Python
To boostrap my Python environment, I installed several packages:
sudo apt-get install build-essential python3-dev python3-openssl \
  python3-setuptools python3-pip python3-wheel python3-yaml python3-influxdb
To read from my DHT22 sensor, I used the Adafruit_Python_DHT package even if it’s deprecated. I’ll try to use the newer Adafruit_CircuitPython_DHT package later.
sudo pip3 install Adafruit_DHTThe code I wrote is based on provided code samples.
To write into the InfluxDB database I used the official Python client. Its documentation can be found here. The code I wrote is based on provided code samples.
Sources
The InfluxDB database can be created with influx CLI tool
influx -execute 'create database dht22'The sources are here, there are 3 files:
-
dht22.py: The Python code to read DHT22 sensor and write the result into InfluxDB -
dht22.yml: The config file telling where the sensor is plugged and which database to use. -
dht22.service: The service unit to place in/etc/systemd/systemto automatically startdht22.pywhen Raspberry Pi boots.
I had 2 kinds of problems:
-
There were holes in the graphs because the polling loop was stuck for more than a minute. At the moment, I ignore why.
-
The sensor returned out of range values (3200% humidity, -10°C inside). So I added measure validation to avoid weird graphs.
Other posts
- 2020-11-28 Build your own CA with Ansible
- 2020-01-16 Retrieving Kafka Lag
- 2020-01-10 Home temperature monitoring
- 2019-12-10 Kafka connect plugin install
- 2019-07-03 Kafka integration tests